Prometheus + Grafana
Prometheus는 오픈소스 모니터링 및 경고 시스템으로, 메트릭 수집과 저장을 담당하고, 주로 시간 기반 데이터(예: CPU 사용률, 메모리 사용량 등)를 수집하여 분석
Grafana는 시각화 및 대시보드 도구로, Prometheus와 같은 데이터 소스에서 데이터를 가져와 시각화 가능
Prometheus로 데이터를 수집하고, Grafana로 그 데이터를 시각화하는 것이 일반적이고, 예를 들어 서버의 CPU 사용량을 Prometheus가 수집한 후, Grafana에서 그 데이터를 실시간으로 그래프 형태로 보여줌으로써 시스템의 상태를 한눈에 파악이 가능
———————————————————————————————————————————
- Rocky 9.4
- 192.168.0.23
- port / 3000, 9100, 9090
———————————————————————————————————————————
- prometheus / node_exporter 다운로드 (node_exporter 모니터링 할 대상 서버도 다운로드)
# prometheus
wget https://github.com/prometheus/prometheus/releases/download/v2.48.0-rc.0/prometheus-2.48.0-rc.0.linux-amd64.tar.gz

# node_exporter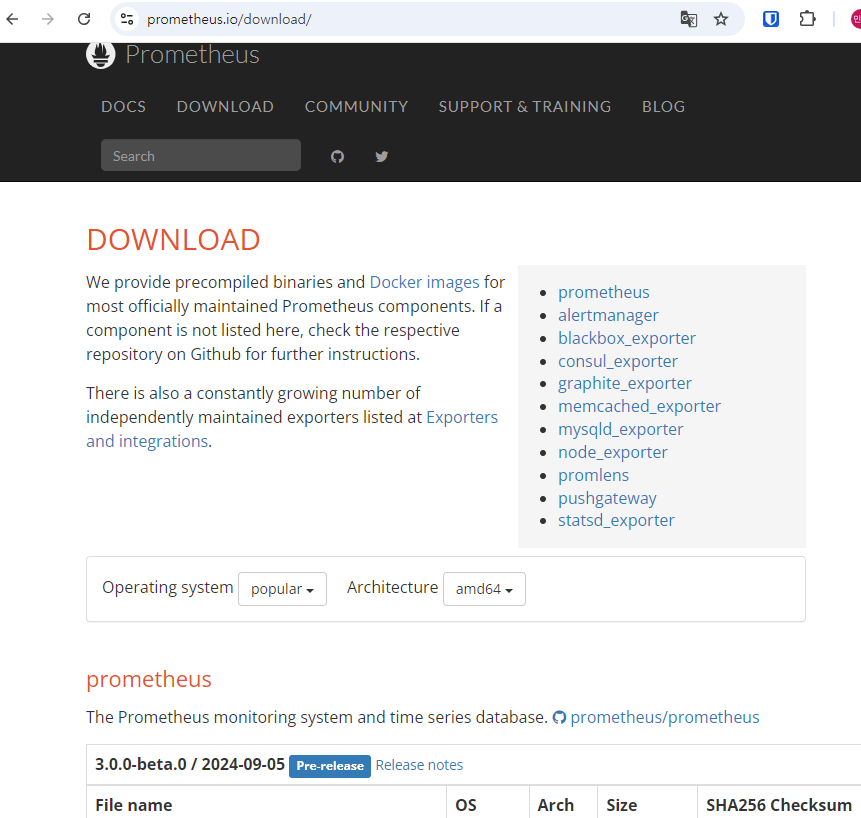
wget https://github.com/prometheus/node_exporter/releases/download/v1.6.1/node_exporter-1.6.1.linux-amd64.tar.gz- prometheus / node_exporter 다운로드 주소
- prometheus.io/download
- 다운로드 파일 압축해제
tar -zxvf- prometheus.yml 추가(prometheus 서버만 해당)
- yaml 파일은 들여쓰기 주의
- targets 모니터링 대상 ip 기입
# Alertmanager configuration
alerting:
  alertmanagers:
    - static_configs:
        - targets:
          # - alertmanager:9093

# Load rules once and periodically evaluate them according to the global 'evaluation_interval'.
rule_files:
  # - "first_rules.yml"
  # - "second_rules.yml"

# A scrape configuration containing exactly one endpoint to scrape:
# Here it's Prometheus itself.
scrape_configs:
  # The job name is added as a label `job=<job_name>` to any timeseries scraped from this config.
  - job_name: "prometheus"

    # metrics_path defaults to '/metrics'
    # scheme defaults to 'http'.

    static_configs:
      - targets: ["localhost:9090"]

  - job_name: "node"

    static_configs:
      - targets: ["192.168.0.23:9100", "192.168.0.22:9100", "192.168.0.24:9100"]
- 방화벽 port 추가
- firewalld 사용
# 포트 추가
firewall-cmd --permanent --add-port=9100/tcp

# 재시작
firewall-cmd --reload

# 포트 추가 적용 되었는지 확인
firewall-cmd --list-all- prometheus 서비스 시스템 등록(prometheus 서버만 해당)
vim /etc/systemd/system/prometheus.service   # 파일 생성


[Unit]
Description=Prometheus Server
Documentation=https://prometheus.io/docs/introduction/overview/
After=network-online.target


[Service]
User=root
Restart=on-failure
ExecStart=/home/moni/prometheus-2.48.0-rc.0.linux-amd64/prometheus \
  --config.file=/home/moni/prometheus-2.48.0-rc.0.linux-amd64/prometheus.yml \
  --storage.tsdb.path=/home/moni/prometheus-2.48.0-rc.0.linux-amd64/data


[Install]
WantedBy=multi-user.target


# 서비스 재기동
systemctl daemon-reload
systemctl start prometheus
systemctl status prometheus
systemctl enable prometheus- node_export 서비스 등록(prometheus 서버와 모니터링 대상 서버 설치)
vim /etc/systemd/system/node_exporter.service


[Unit]
Description=Prometheus Node Exporter
Documentation=https://prometheus.io/docs/guides/node-exporter/
Wants=network-online.target
After=network-online.target


[Service]
User=root
Restart=on-failure
ExecStart=/home/moni/node_exporter-1.6.1.linux-amd64/node_exporter


[Install]
WantedBy=multi-user.target


# 서비스 재기동
systemctl daemon-reload
systemctl start prometheus
systemctl status prometheus
systemctl enable prometheus- 모니터링 대상 서버 방화벽 설정
# 포트 추가
firewall-cmd --permanent --add-port=9100/tcp

# 재시작
firewall-cmd --reload

# 포트 추가 적용 되었는지 확인
firewall-cmd --list-all- 테스트 9090 접속
http://192.168.0.23:9090- Grafana 연동(prometheus 서버에 설치)
sudo yum install -y https://dl.grafana.com/enterprise/release/grafana-enterprise-10.3.3-1.x86_64.rpm
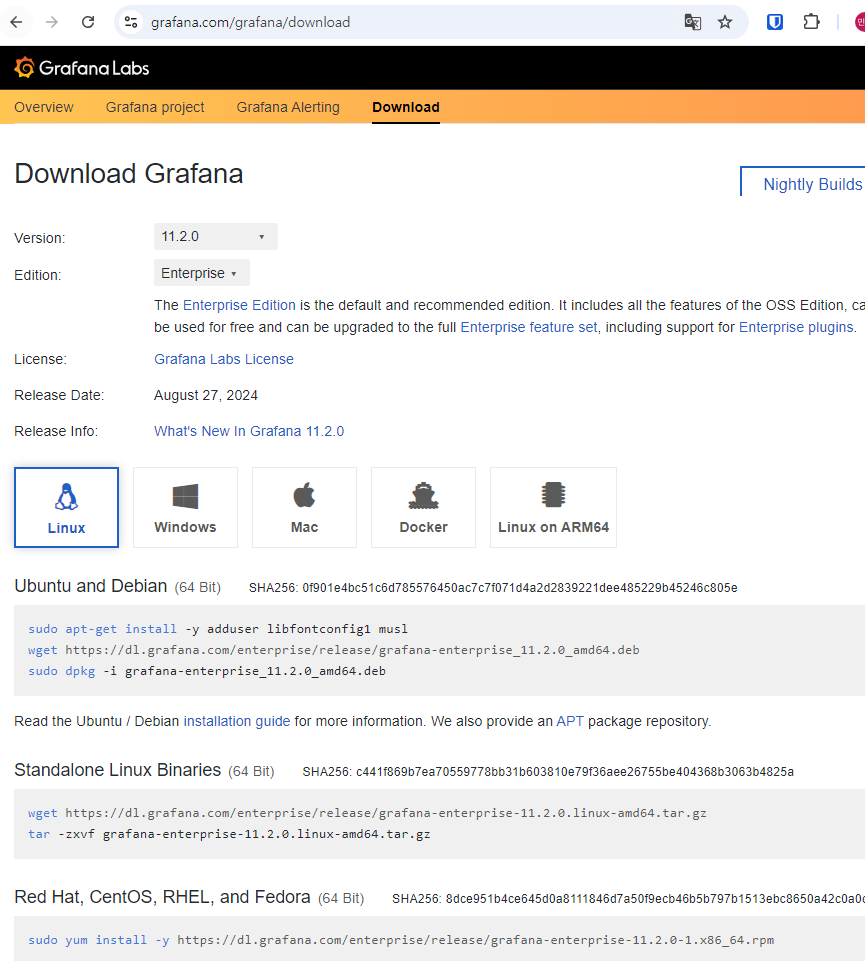
wget https://dl.grafana.com/enterprise/release/grafana-enterprise-8.4.4-1.x86_64.rpm
sudo yum install -y grafana-enterprise-8.4.4-1.x86_64.rpm - grafana 다운로드 웹 주소
- grafana 기동
systemctl start grafana-server

systemctl enable grafana-server- grafana 웹 접속
http://192.168.0.23:3000

# 초기 계정 정보
admin / admin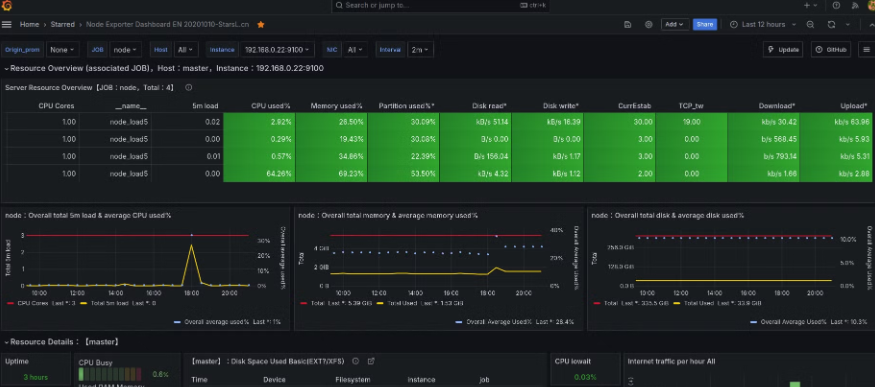
ELK Stack 설치
ELK 스택은 서버의 로그를 수집하고 분석하는 데 유용하고, Elasticesearch는 데이터 저장소, Logstash는 로그 수집 및 처리, Kinbana는 시각화 도구
———————————————————————————————————————————
- Rocky 9.4
- master / 192.168.0.22 (관리 서버)
- node1 / 192.168.0.23
- node2 / 192.168.0.24
———————————————————————————————————————————
- 레포지토리 추가
- master, node1/2 서버 진행
sudo rpm --import https://artifacts.elastic.co/GPG-KEY-elasticsearch
sudo tee /etc/yum.repos.d/elasticsearch.repo <<EOF
[elasticsearch]
name=Elasticsearch repository
baseurl=https://artifacts.elastic.co/packages/7.x/yum
gpgcheck=1
gpgkey=https://artifacts.elastic.co/GPG-KEY-elasticsearch
enabled=1
autorefresh=1
type=rpm-md
EOF- Elaticsearch 설치
- master, node1/2 서버 진행
dnf -y install elasticsearch- Elasticsearch 설정
- master 서버에서 진행
/etc/elasticsearch/elasticsearch.yml


cluster.name: my-cluster
node.name: master
network.host: 192.168.0.22
http.port: 9200
discovery.seed_hosts: ["192.168.0.22", "192.168.0.23", "192.168.0.24"]
cluster.initial_master_nodes: ["master"]- node1 서버에서 진행
/etc/elasticsearch/elasticsearch.yml


cluster.name: my-cluster
node.name: node1
network.host: 192.168.0.23
http.port: 9200
discovery.seed_hosts: ["192.168.0.22", "192.168.0.23", "192.168.0.24"]
cluster.initial_master_nodes: ["master"]- node2 서버에서 진행
/etc/elasticsearch/elasticsearch.yml


cluster.name: my-cluster
node.name: node2
network.host: 192.168.0.24
http.port: 9200
discovery.seed_hosts: ["192.168.0.22", "192.168.0.23", "192.168.0.24"]
cluster.initial_master_nodes: ["master"]- 서비스 시작
systemctl enable elasticsearch --now- 상태 확인
curl -X GET "192.168.0.22:9200/"

curl -X GET "http://192.168.0.22:9200/_cluster/health"
[Logstash 설치]
- 마스터 서버에서 진행
dnf -y install logstash- Logstash 구성 파일 생성
input {
  beats {
    port => 5044
  }
}

filter {
  # 필요한 경우 데이터 필터링 및 변환을 추가
}

output {
  elasticsearch {
    hosts => ["http://192.168.0.22:9200"]
    index => "your-index-name-%{+YYYY.MM.dd}"
  }
}- 서비스 시작 및 자동 실행
systemctl enable logstash --now- 상태 확인
curl -X GET "http://192.168.0.22:9200/_cat/indices?v"[Kibana 설치]
- 마스터 서버에서 진행
dnf -y install kibana- kibana 설정
/etc/kibana/kibana.yml


server.port: 5601
server.host: "0.0.0.0"
elasticsearch.hosts: ["http://192.168.0.22:9200"]- 서비스 시작 및 자동 실행
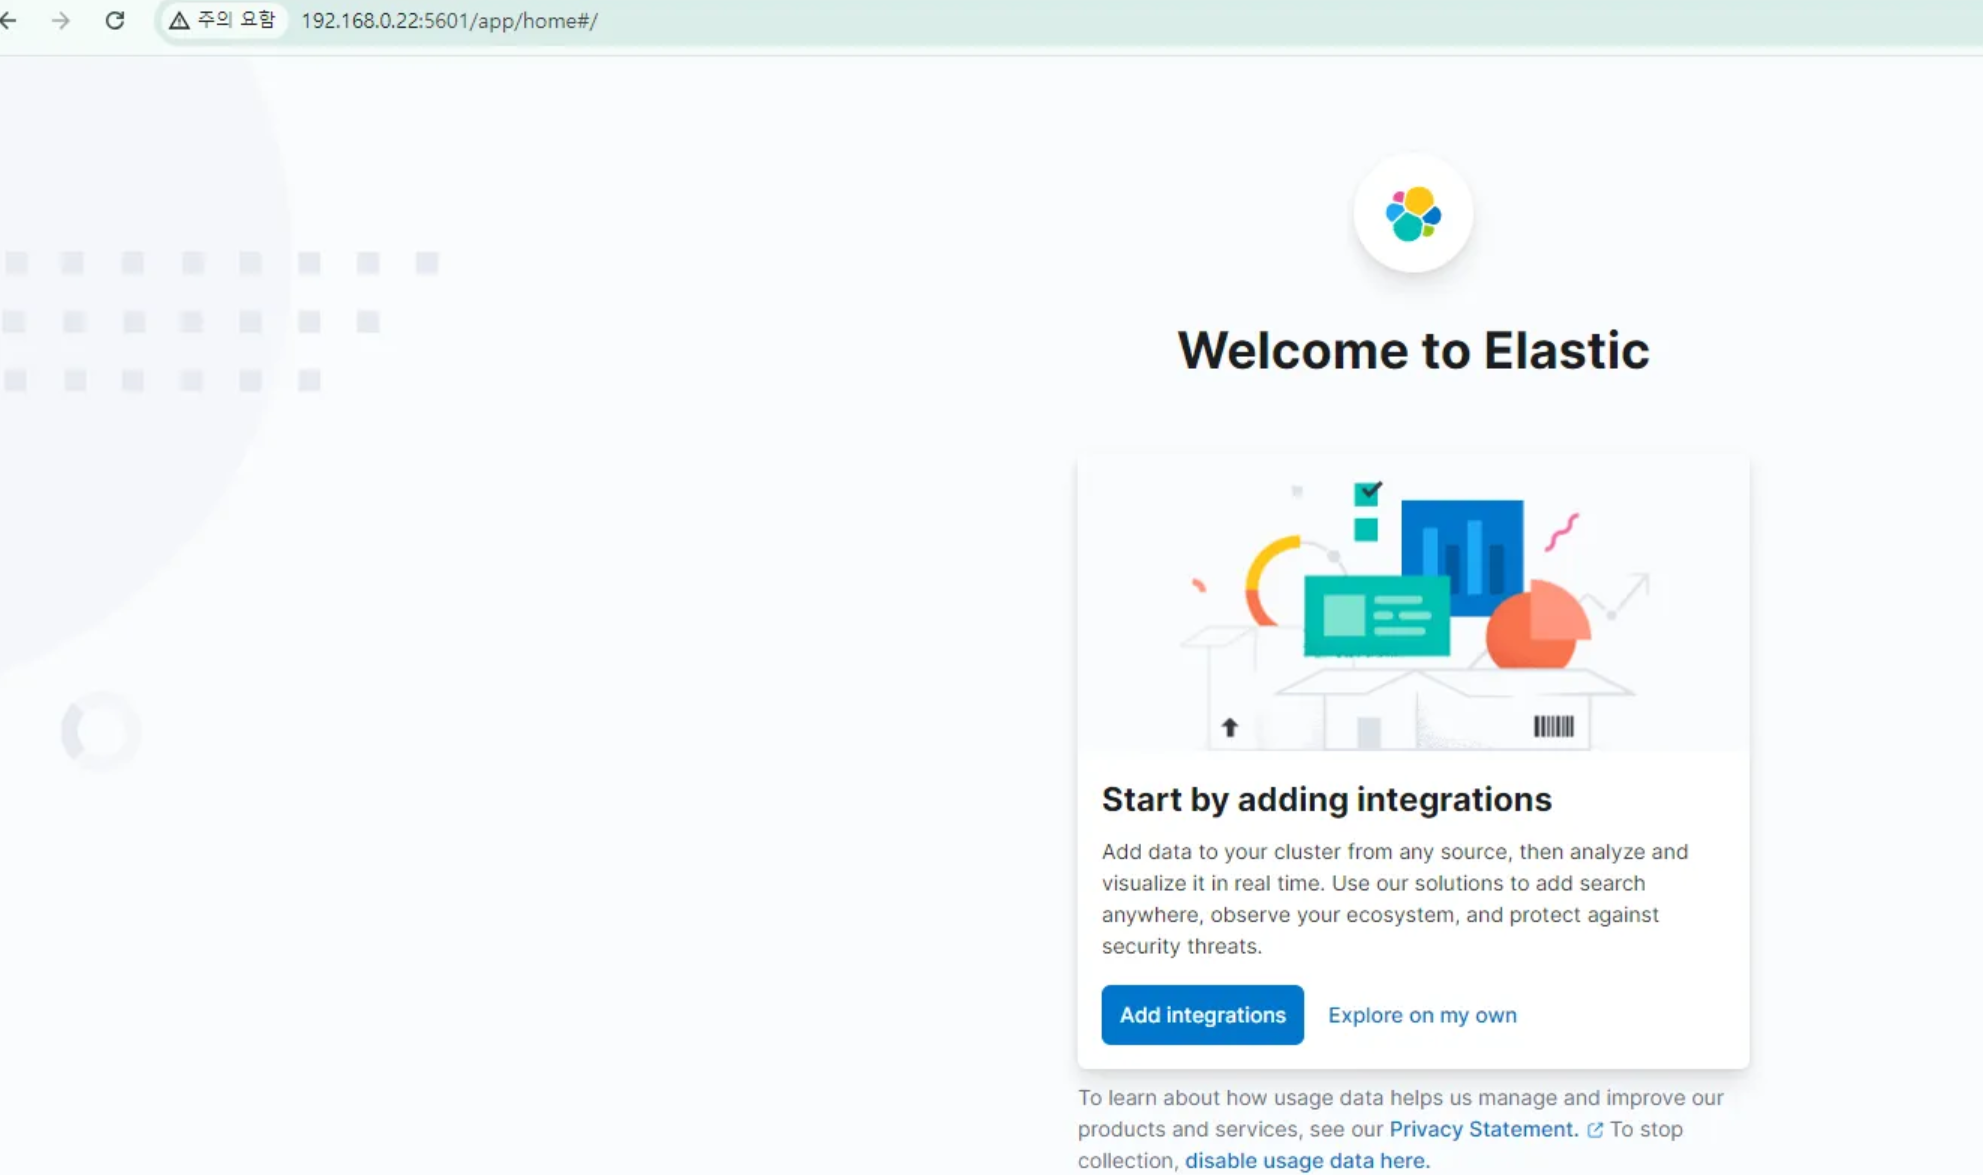
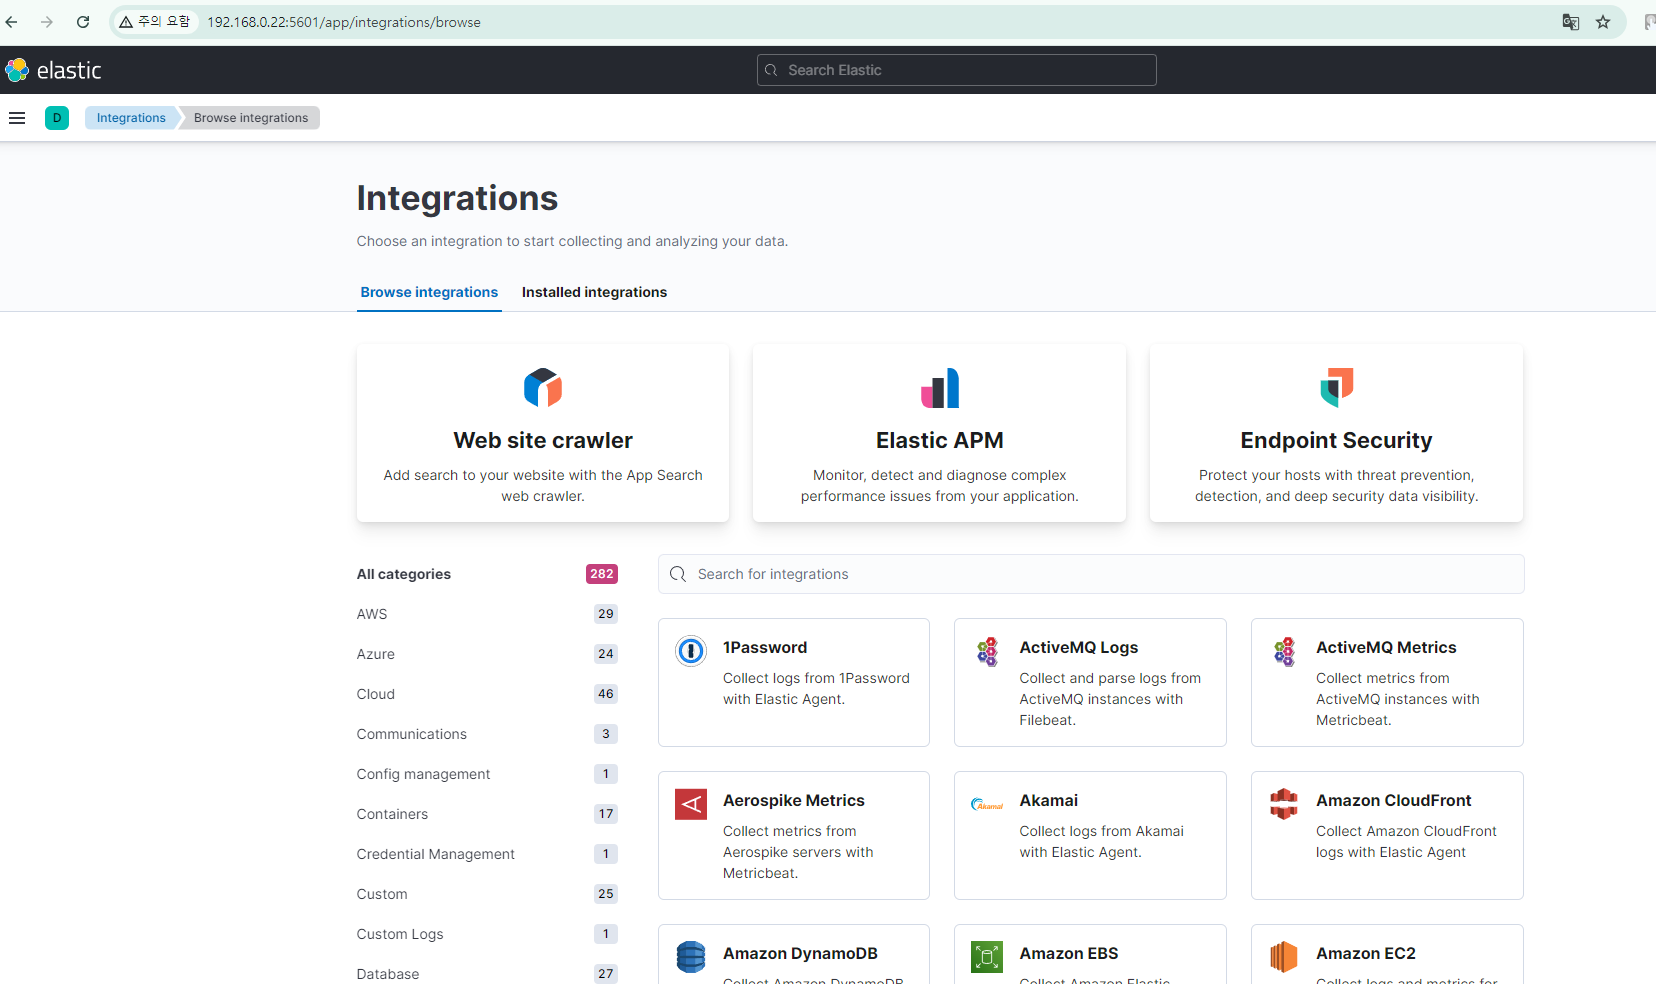
systemctl enable kibana --now- 웹 인터페이스
- http://192.168.0.22:5601